Immission Maps
Data and maps on air pollution
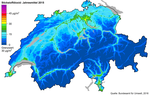
The dispersion model PolluMap
Meteotest, in collaboration with the company INFRAS, has developed PolluMap. It is utilised for particulates, nitrogen dioxide, benzene, BC and sulfur dioxide. On the basis of emission balances, emission cadastres are calculated as a first step. Using transfer functions based on regional climatologies the emissions are converted to immissions.
Our expertise in GIS ensures delivery of the results as clearly presented maps. PolluMap maps are important input maps for the modeling of hourly hybrid maps for pollutant concentrations.
Near-real-time maps of current air pollution
Meteotest, in collaboration with the company INFRAS, has developed PolluMap. It is utilised for particulates, nitrogen dioxide, benzene, BC and sulfur dioxide. On the basis of emission balances, emission cadastres are calculated as a first step. Using transfer functions based on regional climatologies the emissions are converted to immissions.
Our expertise in GIS ensures delivery of the results as clearly presented maps. PolluMap maps are important input maps for the modeling of hourly hybrid maps for pollutant concentrations. PolluMap can be utilised worldwide.
Web platforms bring measurements to the Internet
We create web applications which represent the current air pollution situation in tabular and graphical form.
We publish current air pollution concentration maps in dynamic online maps. Using the PolluMap's base maps and interpolation methods, up-to-date maps are calculated.
Meteotest has created, and manages, the following web applications for the public authorities:

Ask our expert:
Thomas Künzle
Head of Air Quality
| |